Usage Statistics
Hundreds of thousands of drivers choose to use 407 ETR every day. 407 ETR is the world's first all-electronic, open-access highway and offers a fast, safe and reliable trip across the Greater Toronto Area. Below are traffic statistics from the past five years of operation.
Gross Vehicle Kilometres Traveled
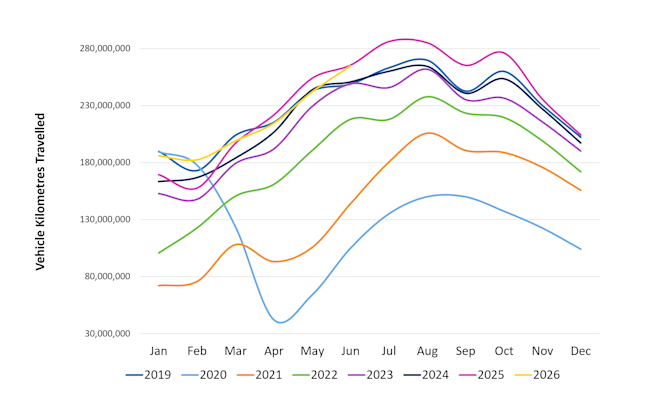
| 2019 | 2020 | 2021 | 2022 | 2023 | 2024 | 2025 | 2026 |
|---|---|---|---|---|---|---|---|---|
Jan | 189,846,475 | 189,382,163 | 72,191,210 | 100,683,598 | 152,902,081 | 163,397,250 | 169,517,460 | 185,949,963 |
Feb | 173,079,909 | 177,694,217 | 75,807,612 | 122,685,376 | 147,928,492 | 166,899,370 | 157,731,081 | 182,457,939 |
Mar | 203,958,702 | 123,688,986 | 108,055,945 | 150,537,096 | 179,273,879 | 183,949,805 | 197,004,147 | 199,080,170 |
Apr | 215,368,383 | 42,105,590 | 93,226,869 | 160,884,111 | 191,988,660 | 206,629,197 | 221,845,113 | 214,503,449 |
May | 242,749,840 | 63,937,262 | 105,616,407 | 190,613,258 | 229,257,119 | 243,726,282 | 254,049,558 | 242,146,728 |
Jun | 248,833,840 | 104,884,196 | 143,927,616 | 217,963,726 | 249,009,586 | 250,662,831 | 265,558,442 | 264,867,004 |
Jul | 263,056,387 | 135,001,112 | 180,357,132 | 217,797,915 | 245,706,153 | 260,001,685 | 286,213,780 | |
Aug | 269,744,021 | 150,040,582 | 205,708,068 | 237,736,021 | 261,782,435 | 264,279,304 | 285,174,221 | |
Sep | 242,630,032 | 149,915,346 | 190,560,050 | 223,411,762 | 235,195,122 | 240,738,025 | 265,373,583 | |
Oct | 259,922,042 | 137,283,085 | 188,752,542 | 219,517,193 | 236,518,483 | 253,418,955 | 276,252,162 | |
Nov | 230,083,876 | 122,546,565 | 175,790,657 | 199,043,229 | 215,711,976 | 226,979,084 | 235,759,052 | |
Dec | 202,290,383 | 104,020,838 | 155,721,152 | 171,943,245 | 190,172,695 | 197,188,855 | 204,357,363 |
Please note that the Vehicle Kilometres Traveled (VKT) data represents a full month based on an average day (workdays and weekends). Month over month comparisons in VKT data (i.e., Jan. '01 to Jan. '02) should take into account the ratio of Number of Workdays to Total Days in each month. Fewer workdays will have the effect of lowering VKT. Consideration should also be made for extension of the highway since opening in 1997.
Average Workday Trips
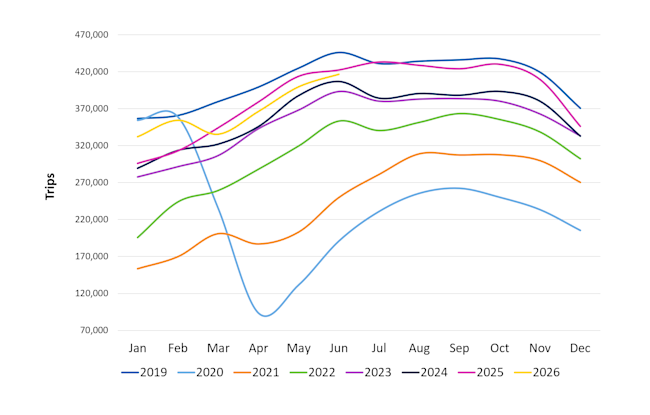
| 2019 | 2020 | 2021 | 2022 | 2023 | 2024 | 2025 | 2026 |
|---|---|---|---|---|---|---|---|---|
Jan | 356,551 | 354,154 | 153,451 | 195,567 | 277,549 | 289,514 | 296,205 | 331,929 |
Feb | 360,674 | 358,742 | 169,764 | 243,702 | 291,431 | 313,545 | 313,081 | 354,183 |
Mar | 379,493 | 235,359 | 200,881 | 259,128 | 306,503 | 322,002 | 344,289 | 335,310 |
Apr | 399,121 | 93,804 | 186,944 | 287,853 | 342,863 | 345,703 | 379,189 | 366,051 |
May | 424,779 | 131,623 | 203,058 | 319,364 | 368,183 | 387,560 | 413,926 | 399,408 |
Jun | 445,971 | 190,929 | 249,834 | 353,104 | 393,319 | 406,604 | 422,471 | 416,367 |
Jul | 430,959 | 230,988 | 281,123 | 340,283 | 380,243 | 384,090 | 433,271 | |
Aug | 434,158 | 255,513 | 308,991 | 351,335 | 383,038 | 390,348 | 428,772 | |
Sep | 435,954 | 262,283 | 307,393 | 363,216 | 383,685 | 388,045 | 424,086 | |
Oct | 437,326 | 250,108 | 307,739 | 355,189 | 380,166 | 393,213 | 430,229 | |
Nov | 419,227 | 233,389 | 299,739 | 338,315 | 362,857 | 379,930 | 409,612 | |
Dec | 370,577 | 205,405 | 270,374 | 302,160 | 333,280 | 332,922 | 346,338 |
Average Daily Trips
| 2019 | 2020 | 2021 | 2022 | 2023 | 2024 | 2025 | 2026 |
|---|---|---|---|---|---|---|---|---|
Jan | 297,444 | 291,284 | 120,423 | 159,898 | 234,248 | 248,182 | 254,304 | 278,025 |
Feb | 297,828 | 291,267 | 139,933 | 208,897 | 248,234 | 267,582 | 262,207 | 299,039 |
Mar | 312,973 | 194,595 | 175,160 | 229,806 | 268,230 | 268,744 | 288,823 | 288,109 |
Apr | 336,692 | 77,045 | 155,037 | 247,009 | 287,908 | 307,223 | 326,670 | 314,208 |
May | 360,195 | 107,237 | 164,819 | 277,436 | 325,444 | 339,002 | 353,087 | 333,398 |
Jun | 372,373 | 170,153 | 218,888 | 317,560 | 353,476 | 349,951 | 369,802 | 368,824 |
Jul | 371,024 | 198,454 | 246,493 | 291,985 | 325,183 | 341,635 | 379,369 | |
Aug | 367,847 | 214,749 | 272,638 | 314,648 | 341,748 | 340,325 | 364,381 | |
Sep | 363,132 | 226,537 | 272,209 | 317,491 | 332,521 | 335,898 | 367,992 | |
Oct | 375,351 | 208,861 | 264,133 | 306,453 | 328,467 | 346,846 | 375,405 | |
Nov | 355,892 | 198,199 | 267,982 | 299,336 | 322,382 | 332,921 | 345,207 | |
Dec | 300,936 | 167,482 | 229,887 | 252,725 | 273,622 | 281,109 | 293,808 |